Smart Port Operation and Scheduling Platform
Smart assistance platform for maximizing vehicle capacity and load efficiency. A container terminal had the equipment and staff, but lacked a precise, data-driven picture of how its entire operation behaved as a system—and what that gap was costing it every day.
The Problem: Running at Full Capacity Until the Simulation Showed Otherwise
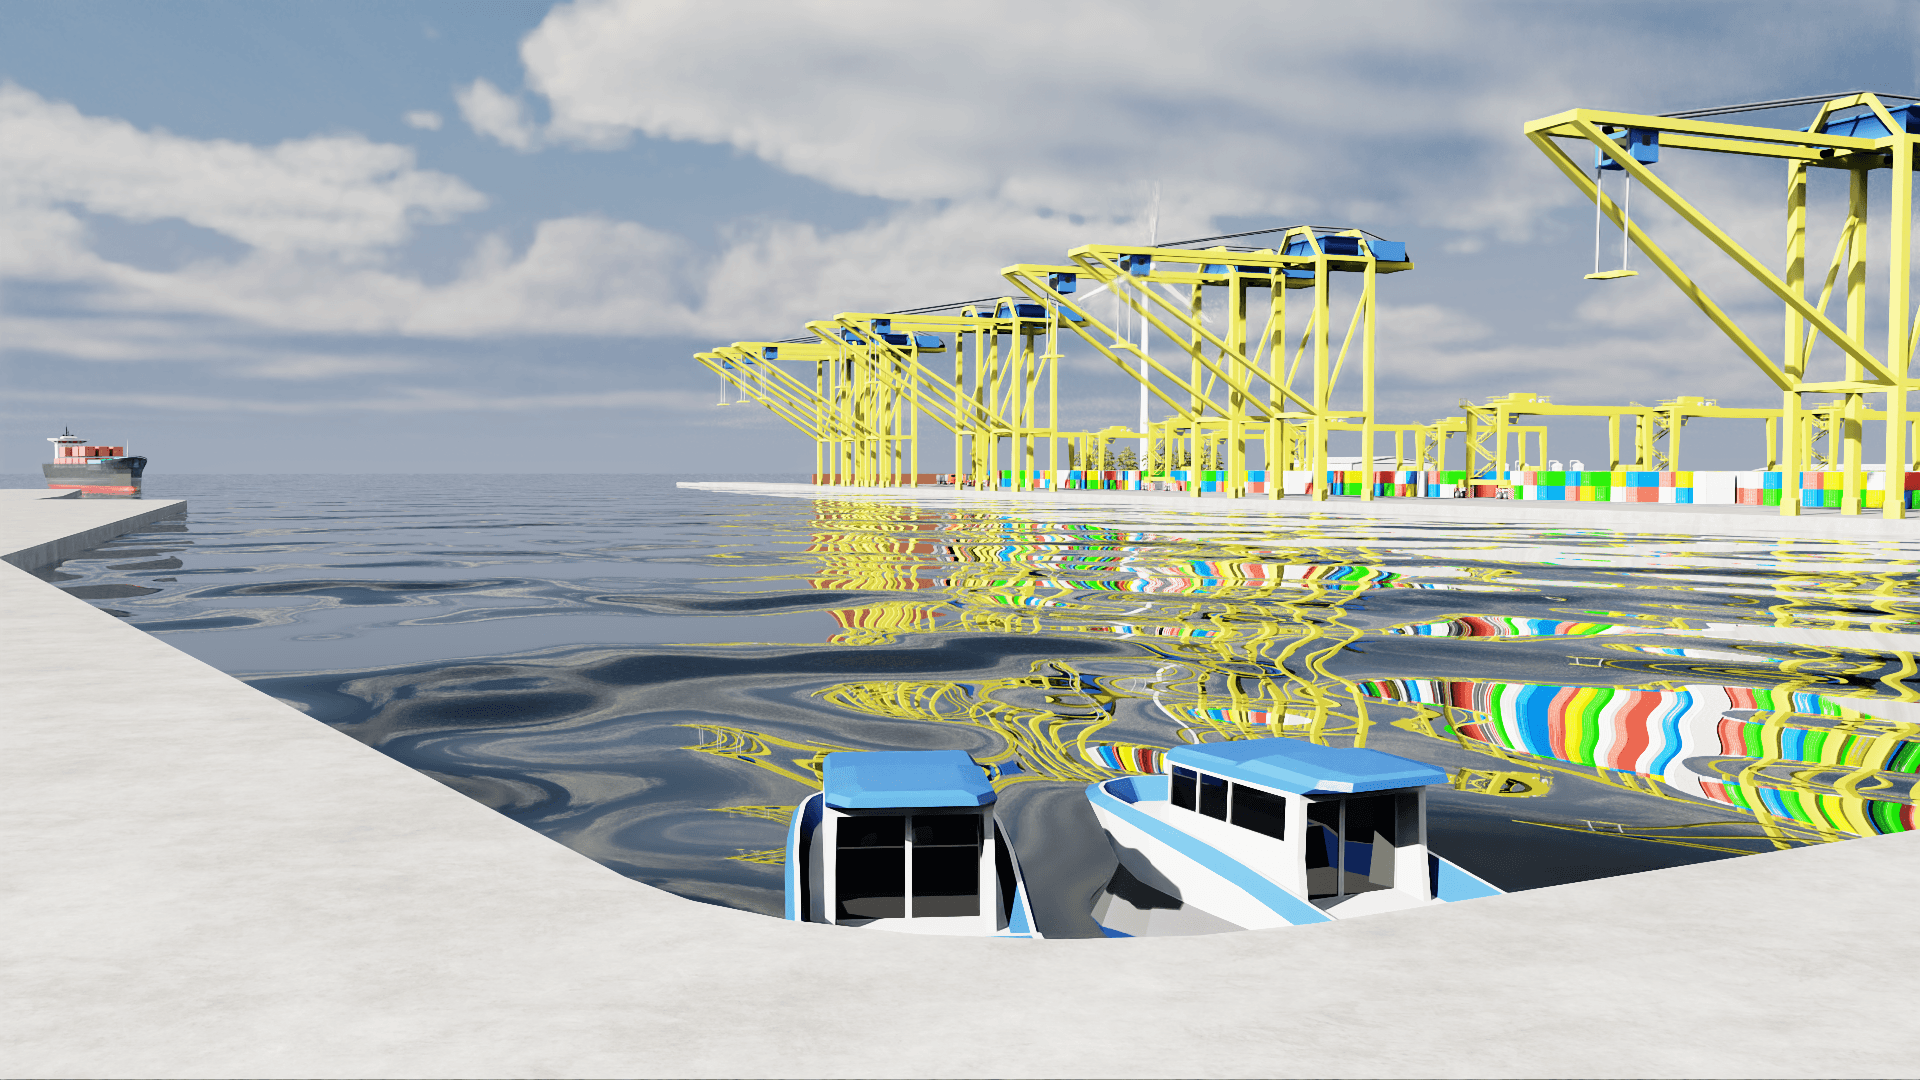
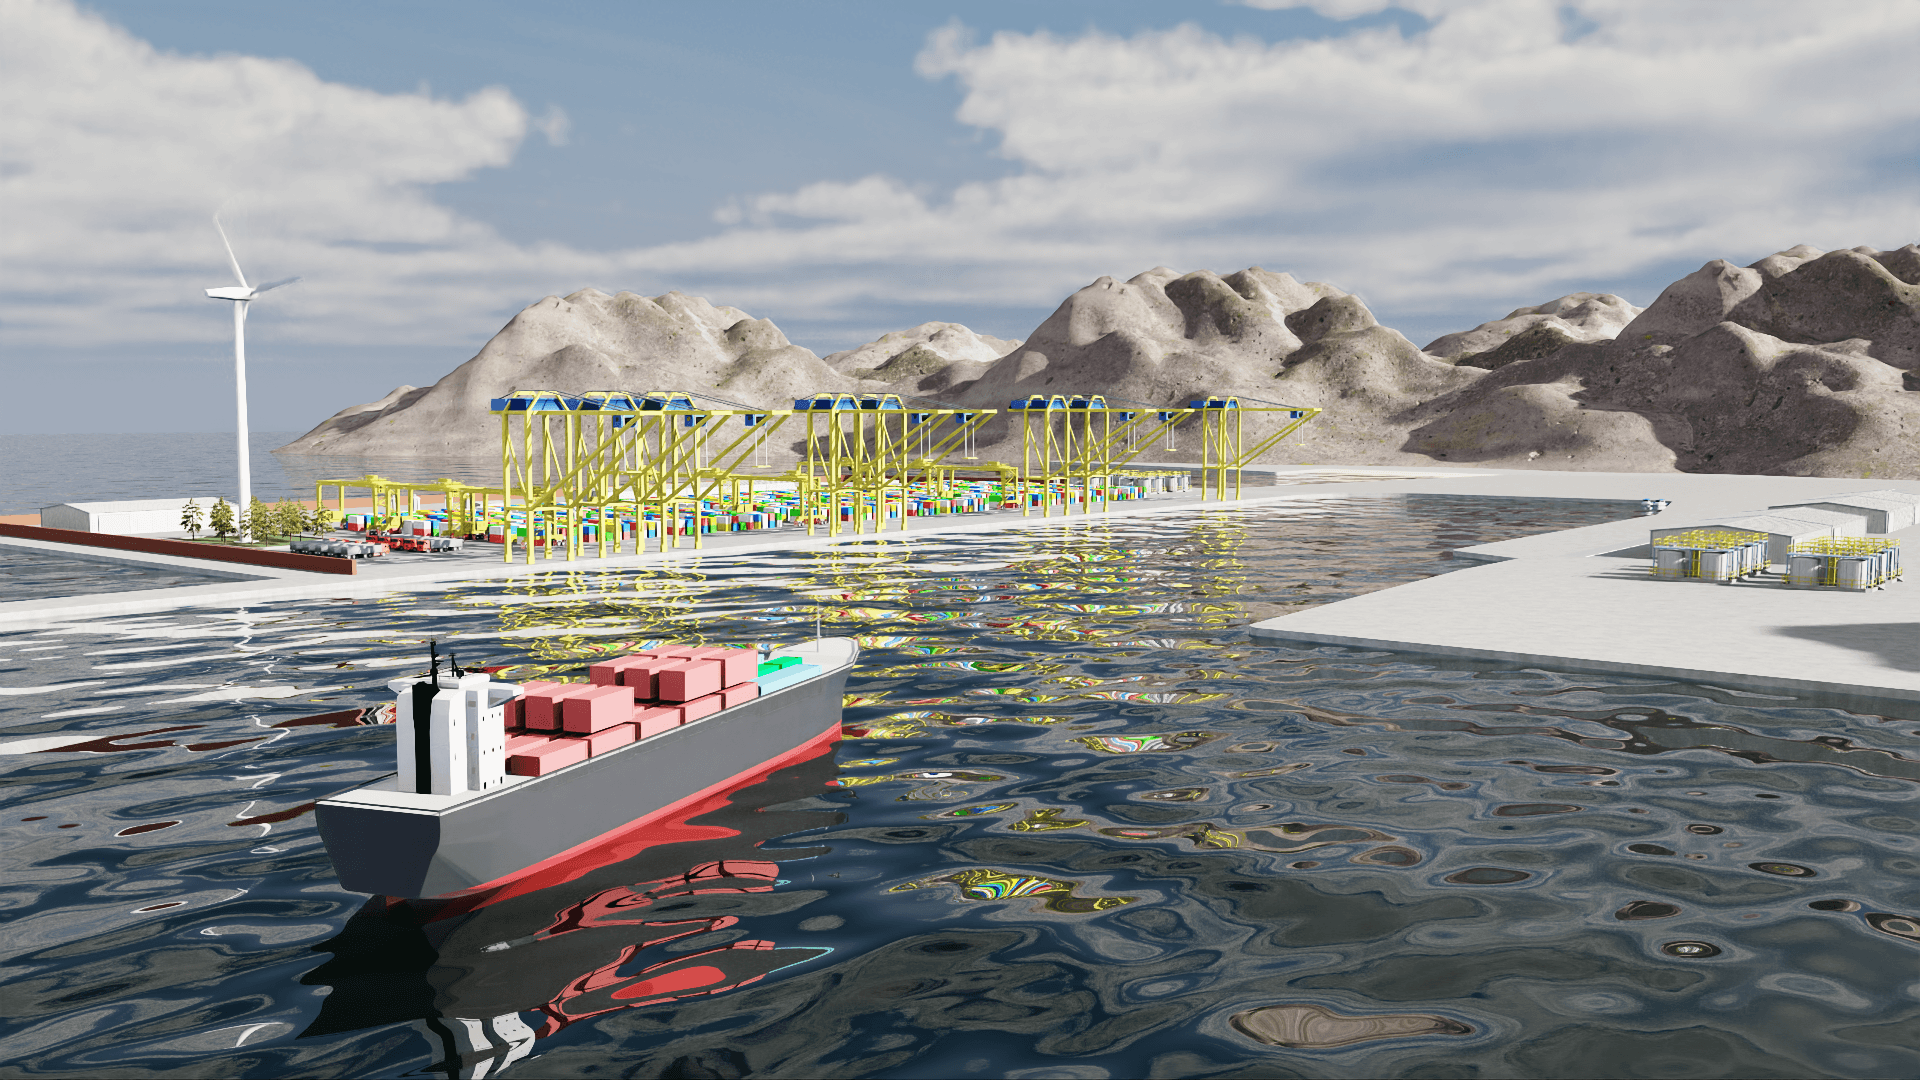
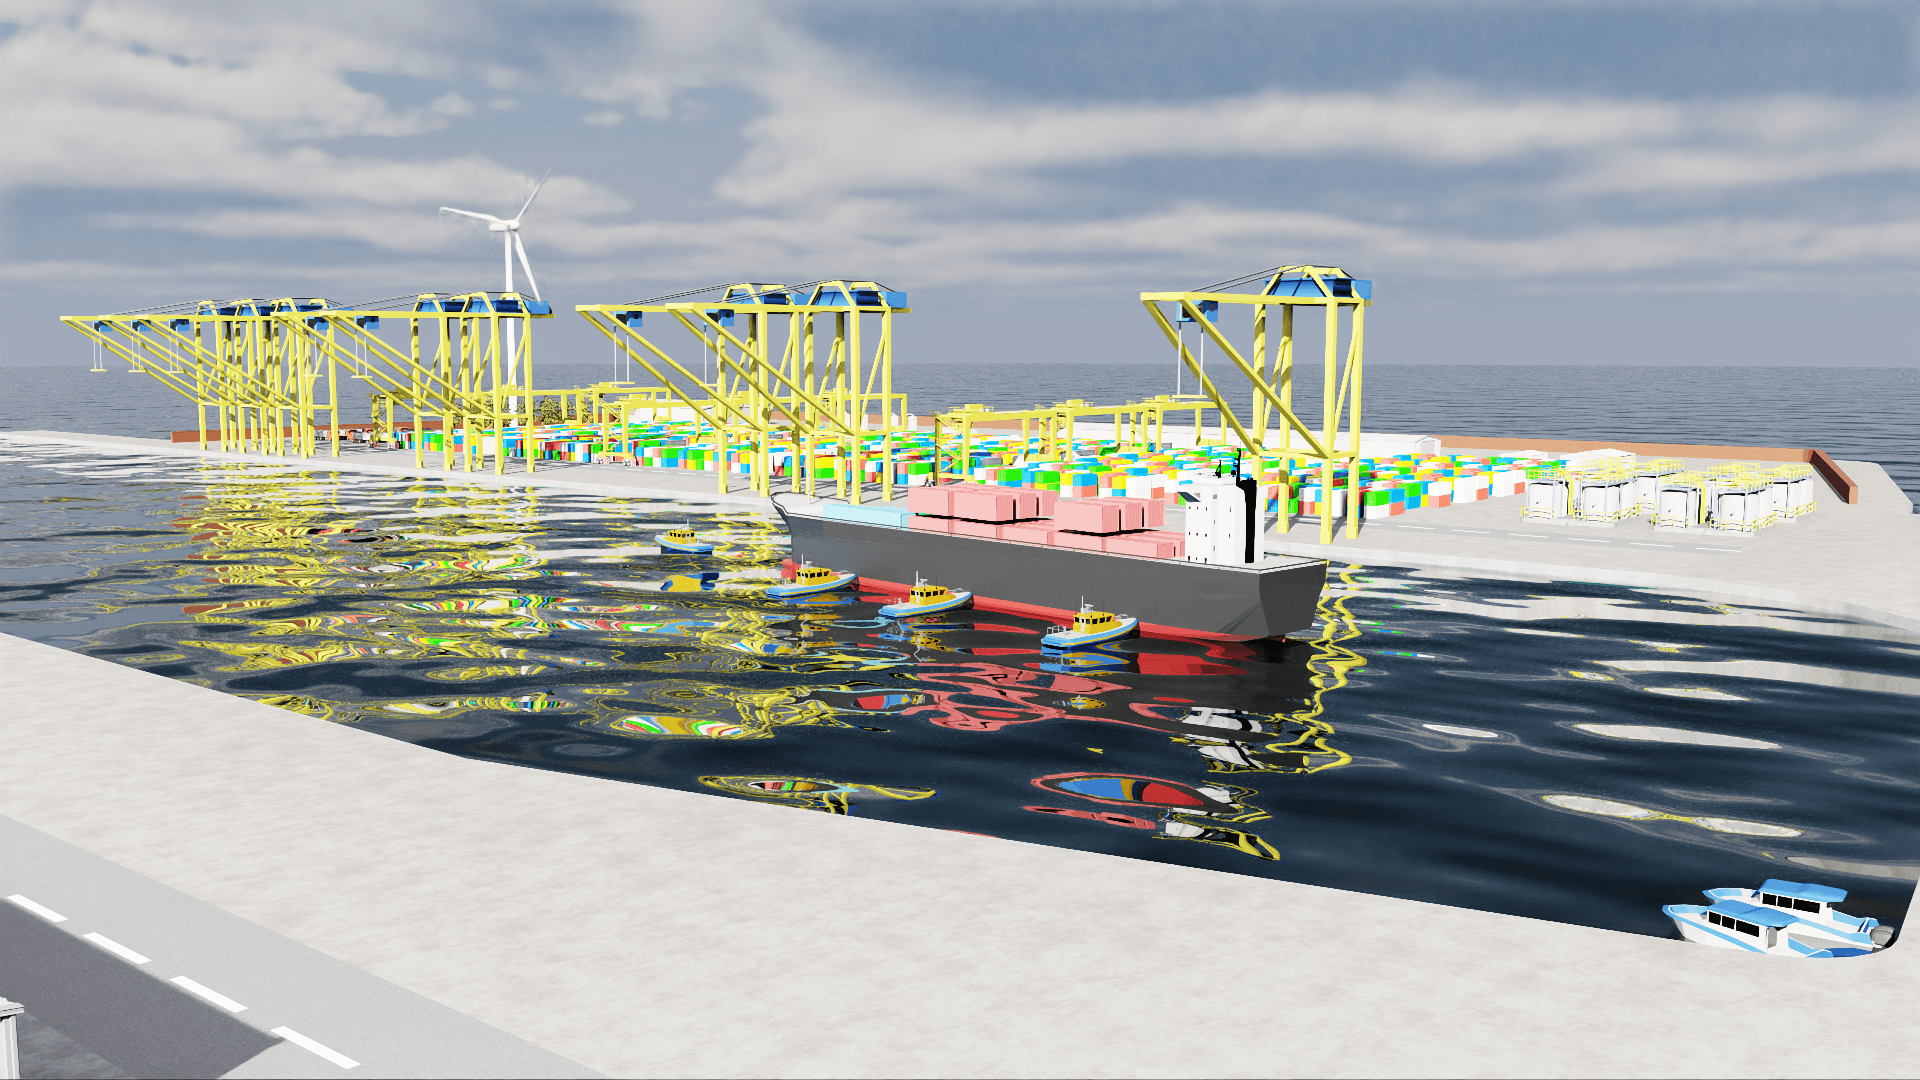
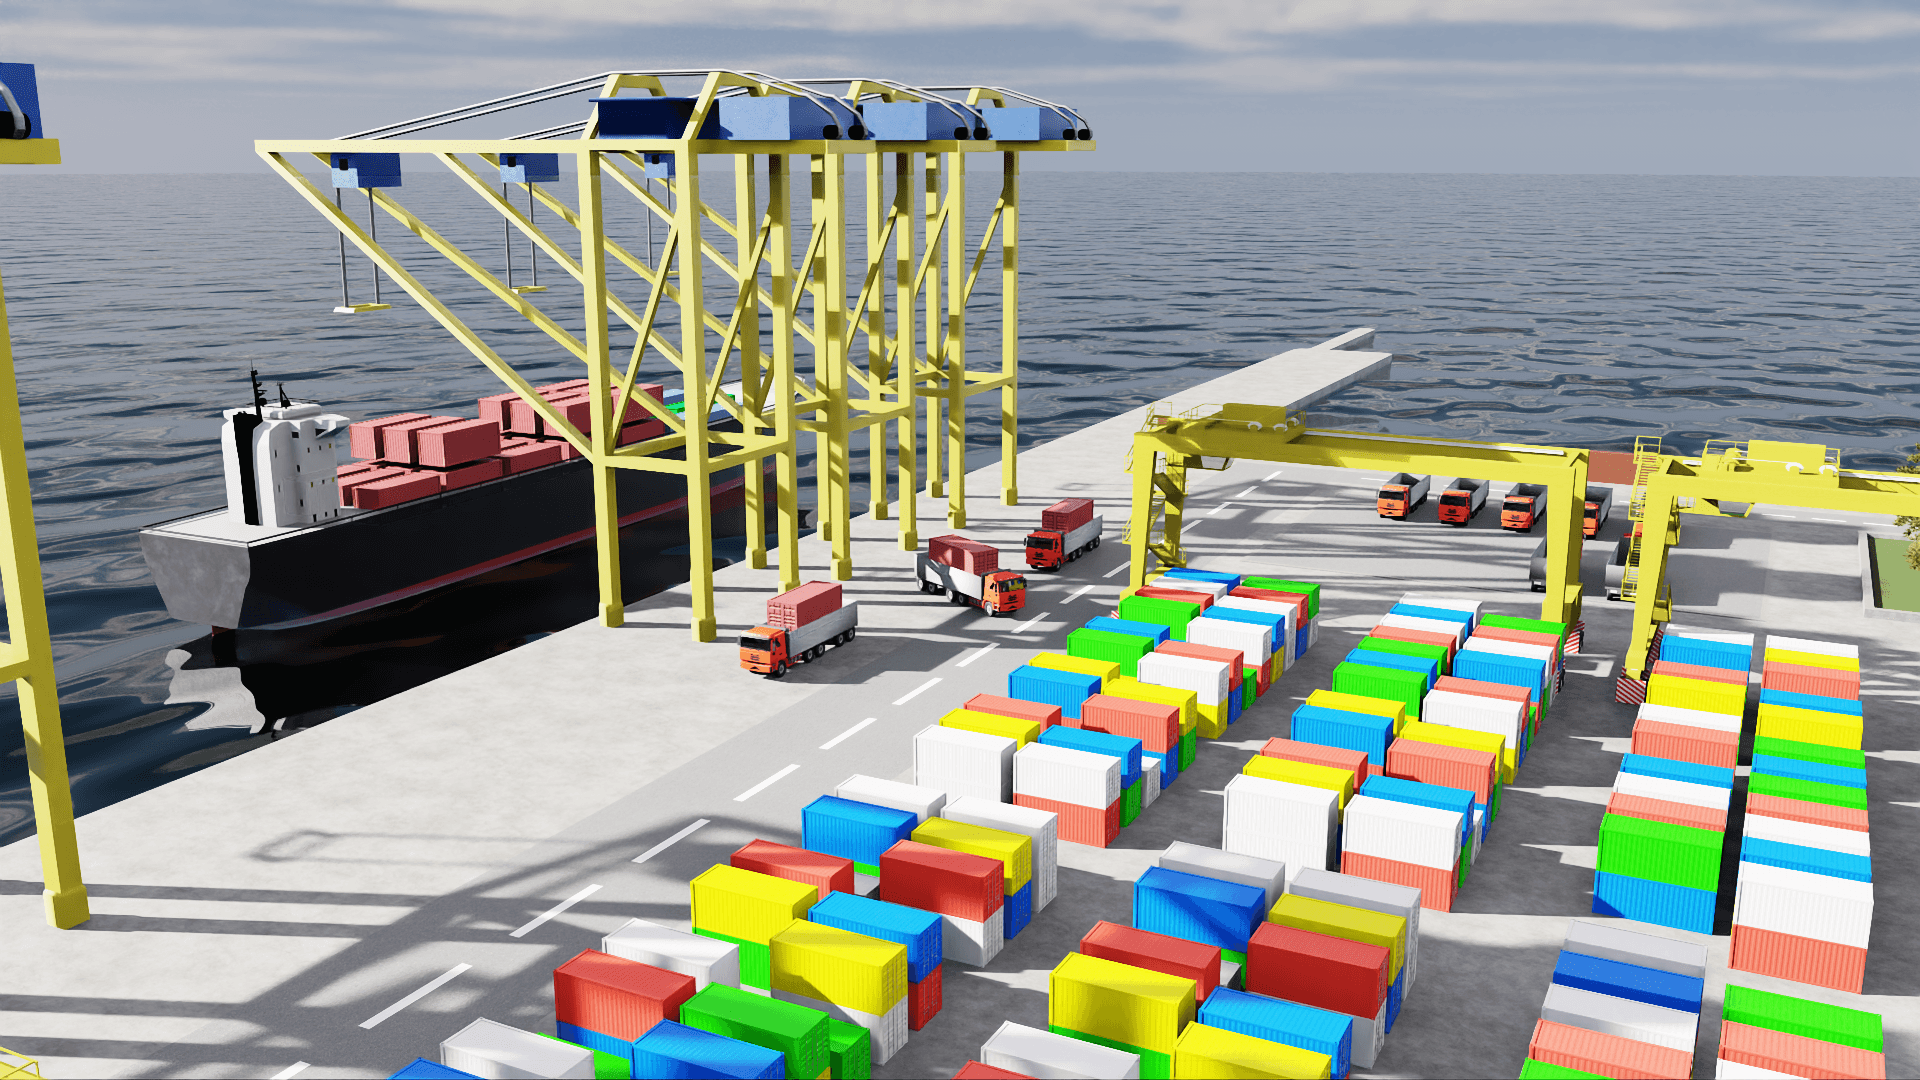
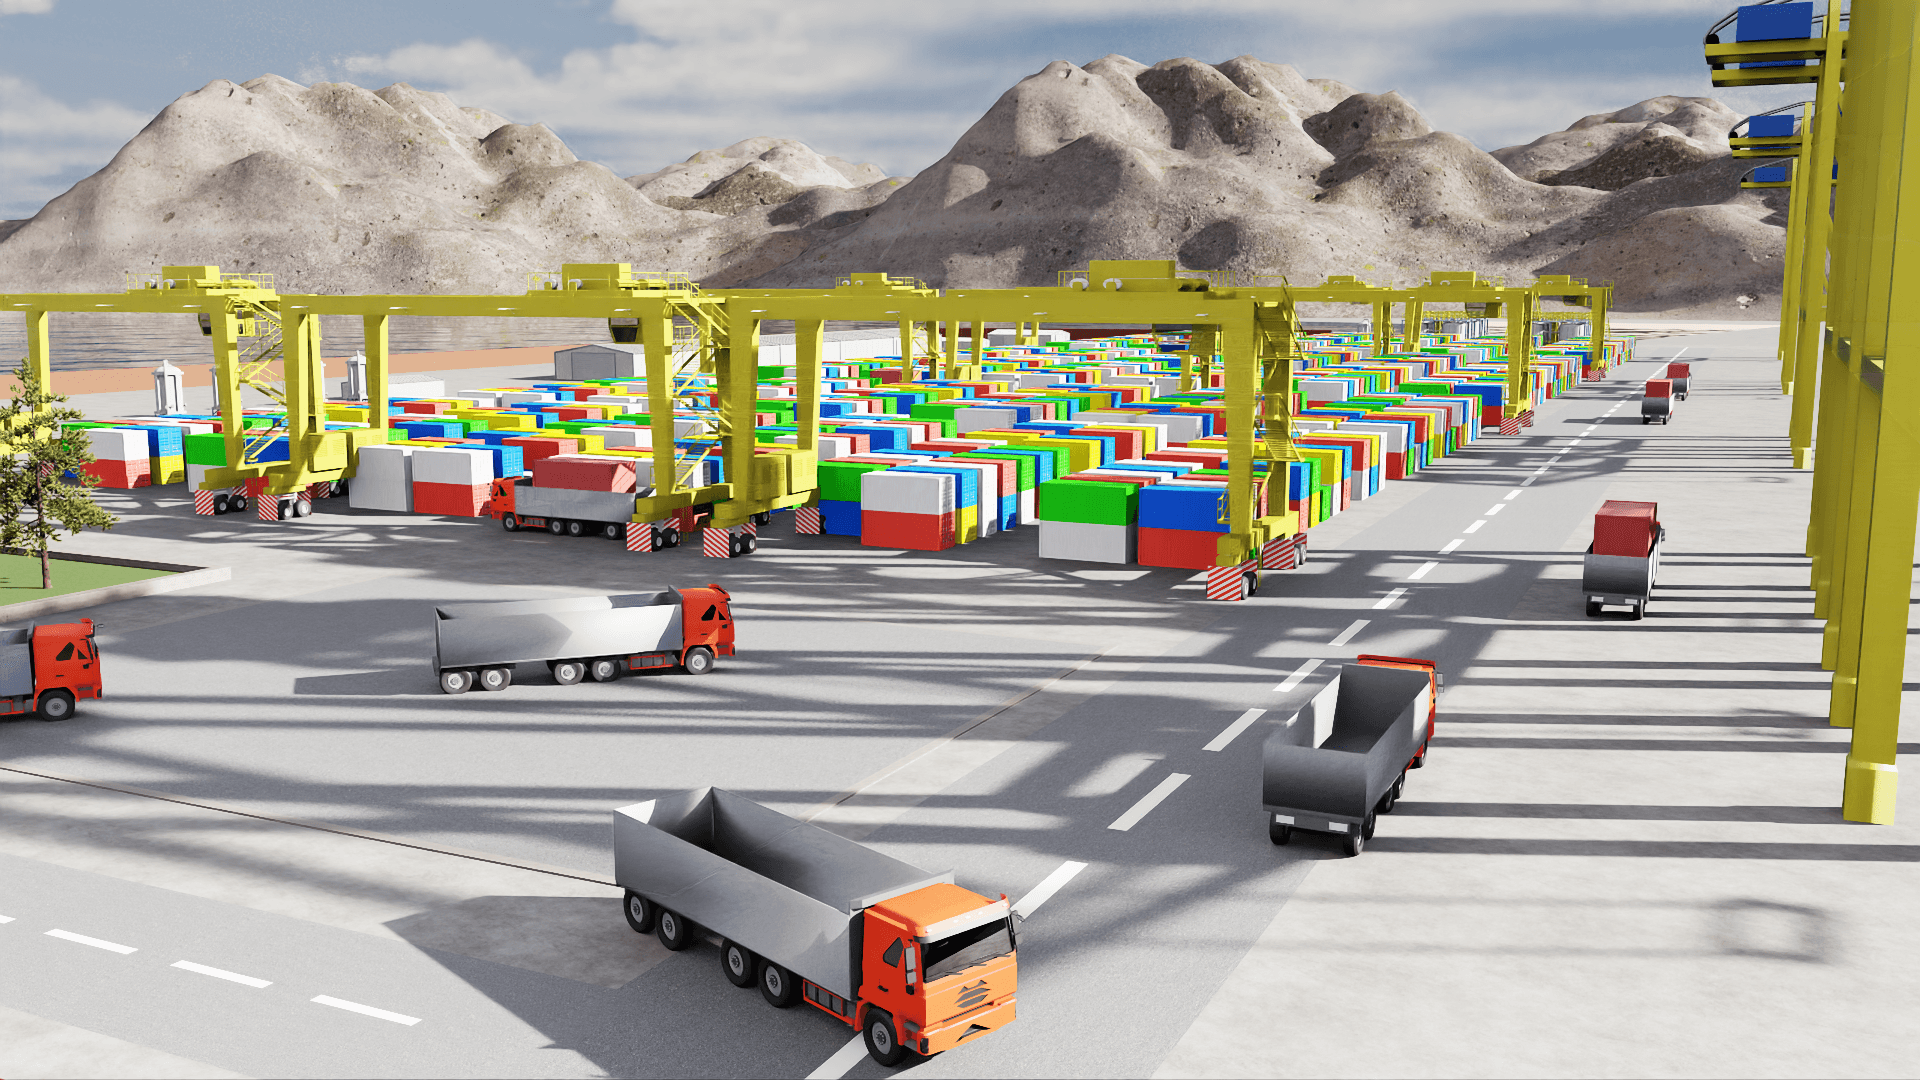
A container terminal possessed the equipment and staff but lacked a system-level model to see how decisions made at individual points created ripple effects across the entire operation. The terminal ran 8 Ship-to-Shore cranes across 4 berths, servicing 3 vessel types with varying container capacities and cargo profiles. Additionally, 9 yard cranes managed container placement across 6 yard lanes, with 10 internal trucks shuttling between the quayside and the yard continuously.
The client faced challenges regarding vessel sequencing, truck dispatching, yard lane allocation, long vessel waiting times, and congestion from suboptimal routing. The initial instinct was to invest in more infrastructure (more cranes, a larger truck fleet, an expanded yard), but infrastructure investment does not resolve a sequencing problem—it only scales it.
Images & Video
Challenges · Solution · Results
- Long vessel waiting times and inefficient crane allocation.
- Congestion from suboptimal yard-truck routing and high idle fuel consumption.
- Limited visibility into dynamic port operations and their real-time impact.
- Difficulty evaluating scheduling strategies without a safe, controlled testing environment.
- Lack of a system-level model to understand operational ripple effects.
- Multi-method simulation of vessel arrivals, berthing, crane usage, and yard logistics using EBI SIM.
- Optimization engine evaluating the full policy space across all input combinations for dynamic prioritization, crane assignment, and routing plans.
- Sustainability tracking for energy and fuel evaluation, including correlating crane activity timing with energy consumption peaks.
- Omniverse-based 3D digital twin and VR environment for real-time visualization and scenario testing.
- Reduced vessel turnaround time and improved crane and yard-equipment utilization.
- Lower fuel consumption and enhanced environmental performance.
- Better operational visibility through immersive digital twin integration.
- Stronger decision-making supported by data-driven scenario analysis.
- Avoided capital investment in additional quay cranes and truck fleet expansion.
- Prevented weeks of live trial-and-error with real vessels and cargo.
In-Depth Documentation
What AlsanX Did
AlsanX built a full dynamic simulation of the terminal using EBI SIM, modeling all 8 quay cranes, 9 yard cranes, the 10-truck internal fleet, all 4 berths, and all 6 yard lanes at full operational fidelity. Stochastic inputs—such as variable vessel arrival times, fluctuating cargo volumes, and equipment availability rates—were incorporated to reflect realistic operating variability.
Six optimization parameters were modeled simultaneously using a built-in search engine that evaluated the full policy space: Crane-to-Vessel Assignment, Truck Dispatch Policy, Yard Zone Allocation, YC Workload Balancing, Energy Peak Scheduling, and Berth Scheduling. Outputs were delivered in three formats: a 2D top-view of container flow, a full 3D model, and a high-fidelity VR environment in NVIDIA Omniverse for scenario testing.
The Outcome
Average container handling time improved by 15% under the optimized policy. Internal truck movements decreased by 8% for equivalent throughput, and vessel waiting time at the berth queue fell by approximately 1.5 hours per call under peak conditions. None of these results required new equipment; instead, they required a different operating policy that was safely validated in simulation before being applied to the live terminal floor.
What the Simulation Found
- QC Sequencing: Crane sequencing—not crane count—was identified as the primary driver of downstream delay.
- YC Workload Imbalance: Workload imbalance across the 9 yard cranes created severe zone congestion while other areas sat idle.
- Redundant Routing: The 10-truck fleet contained redundant routing patterns that added travel distance without yielding any throughput gain.
- Energy Peaks: Energy peaks were proven to be scheduling-driven rather than volume-driven.
What the Client Avoided
- Capital Investment: Avoided unnecessary capital expenditure on additional quay cranes.
- Fleet Expansion: Blocked expansion of the internal truck fleet beyond the existing 10 units.
- Live Trial-and-Error: Eliminated weeks of risky, live trial-and-error testing with real vessels and cargo.
- Infrastructure Spend: Made expensive infrastructure spend on additional yard zones completely unnecessary through optimized allocation.
Tools & Technologies
Is your terminal running at capacity, or just running?
Ask us for a Port Operations Audit.
Get in Touch →Explore more case studies
See how we've applied these methods across logistics, manufacturing, and beyond.
View All Case Studies →